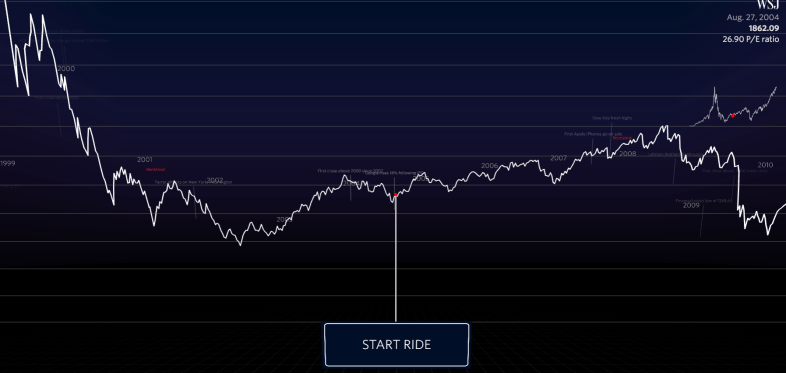
You Can Take A Ride On This WSJ Virtual Reality Guide Of NASDAQ’s Highs And Lows

Sometimes, you just want to be taken on a wild ride. Maybe you’ve thought about going down the troughs of the early 2000s and up the positive gains of the last five years. Well, you can do that now with this kick-ass interactive chart by Cooper Union graduate and designer Ana Asnes Becker and graphic designer Roger Kenny both designers at the Wall Street Journal.
NASDAQ, founded in 1971, is the second-largest market in the United States. It was the world’s first electronic market and was at first unpopular with brokerages (because these brokerages made money on the spread).
As of writing, NASDAQ has surpassed its closing record for the first time in 15 years.
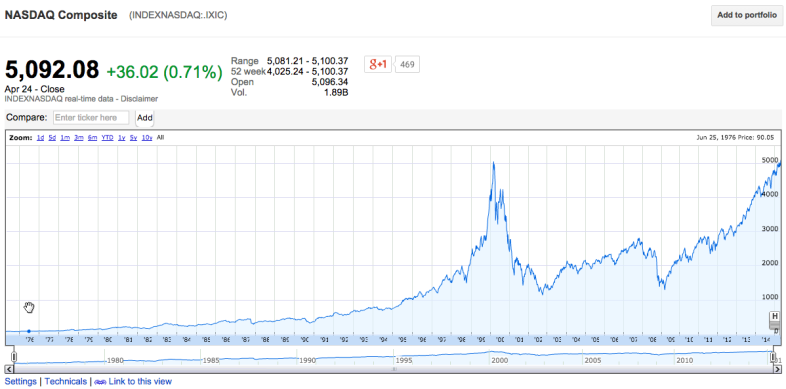
The question remains: Is NASDAQ in another bubble? (NASDAQ’s previous “peaking point” was recorded on March 10, 2000. NASDAQ hit 5,132.52. Within a week it would fall 400 points, rise 200 points, and fall to 1139.90 on October 4, 2002. It would slowly “rebound” to around 2700 in late 2007, but the subprime mortgage crisis would wipe out any gains in the past five years. On March 6, 2009, NASDAQ was recorded at 1293.85. Today, just six years later, April 24, 2015, NASDAQ closed at its highest in 15 years: 5,092.09.) (And it looks like the editors over at ZeroHedge claim the S&P 500 hitting its new high was completely manufactured.)
While you’re pondering this delightfully terrifying question, take a moment to ride on the history of NASDAQ’s growths and declines. ![]()